Abstract
The Monterrey Metropolitan Area (MMA), the largest urban and industrial center in northeastern Mexico, faces increasing groundwater stress driven by rapid urban expansion, recurrent drought, and limited surface-water availability. Since 2024, the San Juan River has been considered a potential source of treaty water under the 1944 U.S.–Mexico Water Treaty, further intensifying pressure on regional water resources. This study evaluates changes in groundwater recharge potential between 1990 and 2022 using an integrated Remote Sensing–Geographic Information System framework combined with the Analytic Hierarchy Process. Eight thematic layers—geology, structural lineaments, slope, geomorphology, precipitation, drainage density, Normalized Difference Vegetation Index, and soil type—were weighted to derive a Groundwater Potential Index and delineate recharge zones. Results show a pronounced redistribution of recharge capacity over 32 years. Very low recharge areas increased by 1021.3 km2, while very high recharge zones decreased by 100.4 km2. In total, more than 1100 km2 experienced degradation in recharge potential, mainly associated with urban growth and land-use change. These findings highlight the urgent need for sustainable groundwater management, stronger land-use planning, and protection of recharge areas. Coordinated action among stakeholders and robust regulatory enforcement will be essential as the region navigates future growth and international water obligations.
1. Introduction
Groundwater constitutes a critical yet increasingly stressed component of global freshwater resources, particularly in rapidly urbanizing and water-scarce regions. Worldwide, accelerated urban expansion, land-use change, and climate variability have significantly altered natural recharge processes, leading to declining groundwater levels and reduced system resilience [1,2,3]. Urbanization intensifies groundwater stress by increasing impervious surfaces, modifying drainage networks, and disrupting soil–vegetation interactions, thereby limiting infiltration and natural recharge while simultaneously increasing water demand [4,5]. Under these conditions, identifying, preserving, and managing groundwater recharge zones has become a central challenge for sustainable urban water management.In arid and semi-arid regions, groundwater often serves as the primary buffer against surface-water scarcity and hydroclimatic extremes. However, climate change has amplified the frequency and severity of droughts, further increasing reliance on groundwater systems whose recharge capacity is progressively constrained by urban growth [6,7]. This dynamic is especially pronounced in large metropolitan areas, where competing demands from domestic, industrial, and agricultural sectors converge, and where land-use planning decisions can irreversibly compromise recharge areas if not guided by hydrogeological evidence.The Monterrey Metropolitan Area (MMA), home to 5.8 million people and located in northeastern Mexico, exemplifies these challenges. As one of the country’s most important industrial and economic hubs, the MMA has experienced sustained annual population growth and rapid territorial expansion over recent decades [8,9]. The region is characterized by limited and highly variable surface-water availability, which culminated in an acute water crisis during the 2021–2023 drought [10,11,12,13].According to studies on water availability by the National Water Commission (Comisión Nacional del Agua—CONAGUA) [14,15,16,17,18,19,20,21,22,23,24,25,26,27,28,29,30], the water availability—defined as the volume that can be legally granted in the region from both surface water and groundwater—indicates that the water supply in the MMA is insufficient. This is because the annual outflow of surface and groundwater normally exceeds the inflow. In parallel, since 2024 the San Juan River—a tributary of the Rio Grande that drains the MMA—has been formally considered a potential source of treaty water under Minute 331 of the 1944 United States–Mexico Water Treaty, increasing hydrological and institutional pressures within the Lower Rio Grande basin [31,32]. Under these conditions, groundwater has emerged as an indispensable strategic resource for regional water security.Groundwater in arid and semi-arid regions is a key component of both the hydrological cycle and socioeconomic development. It offers significant benefits, such as enhanced drought resilience, generally better water quality, lower treatment costs, and a slower response to climate variability compared to surface water. Additionally, these sources can be utilized for both public supply and private use independently. Their attractiveness in terms of capital investments further underscores their value as a reliable and sustainable water resource [12,33,34].Despite its importance, the groundwater system underlying the MMA is subject to growing stress from overexploitation, declining recharge, and progressive land sealing. Previous studies in the region have documented groundwater-level declines, water-quality deterioration, and increasing vulnerability of aquifer systems to urbanization and climate variability [35,36,37,38]. Nevertheless, spatially explicit assessments of how recharge potential has evolved over time in response to sustained urban growth remain limited, constraining the ability of decision-makers to integrate groundwater protection into land-use and water-management policies.Identifying and delineating Groundwater Recharge Zones (GWRZ) is vital for managing water supply during extreme hydrological events [39,40,41] with the objective to protecting recharge zones to ensure the preservation of groundwater quantity and quality in the long run [41,42,43]. The relationship between the amount of rainfall and natural groundwater recharge is mainly governed by factors such as geology, structural lineaments, slope, precipitation, drainage density, land use/land cover, and soil type, and the interrelationship between these factors [44,45,46].The use of conventional techniques to delineate GWRZ, such as geological, geophysical, geostatistical, and numerical modeling, is costly, labor-intensive, and time-consuming [47,48]. Similar limitations of traditional groundwater exploration methods have been widely reported in regional-scale studies, emphasizing the high costs and extensive field requirements of conventional approaches [49,50]. However, with the advent of powerful and high-speed computers, efforts have been made to identify groundwater recharge sites using satellite imagery/remote sensing (RS) and geographic information system (GIS) analysis [49,50,51,52] which offer systematic, cost-effective, and timely procedures to produce a reliable methodology for identifying GWPZ on a larger scale compared to conventional methods [53,54].Recently, RS and GIS techniques have been integrated with multi-criteria evaluation (MCE) technology to develop hydrogeological studies [55]. The Analytic Hierarchy Process (AHP) [56] is an MCE technique that considers both subjective and objective characteristics in the decision-making process [57]. The AHP method has been applied successfully by integrating MCE with RS and GIS techniques [52,56,58] due to its simplicity, transparency, effectiveness, and reliability [59,60]. Despite its broad use, the intersection between potential groundwater-recharge zones and future urban development areas has rarely been examined. Identifying these overlapping zones is essential for land-use planning that prioritizes aquifer protection and sustainable resource management. However, many applications remain static in nature, providing snapshot assessments that do not explicitly capture long-term changes driven by urban expansion.Against this background, the present study evaluates the evolution of groundwater recharge potential in the Monterrey Metropolitan Area between 1990 and 2022 by integrating geological, geomorphological, hydrological, climatic, vegetation, soil, and land-use factors using remote sensing, GIS, and the AHP. By comparing recharge potential across two time slices and explicitly accounting for land-use change, this work moves beyond static mapping approaches to quantify the degradation of recharge capacity associated with long-term urban expansion. Furthermore, the study provides a spatially explicit basis for identifying areas where groundwater recharge is most vulnerable to continued development.The results aim to support evidence-based land-use planning, groundwater protection, and water-resource management in the MMA under increasing climatic uncertainty and institutional pressure. More broadly, this research contributes to the growing body of work linking urban growth, recharge loss, and groundwater sustainability, and demonstrates how recharge potential mapping can inform proactive strategies to safeguard critical subsurface water resources in rapidly expanding metropolitan regions.
2. Materials and Methods
2.1. Study Area
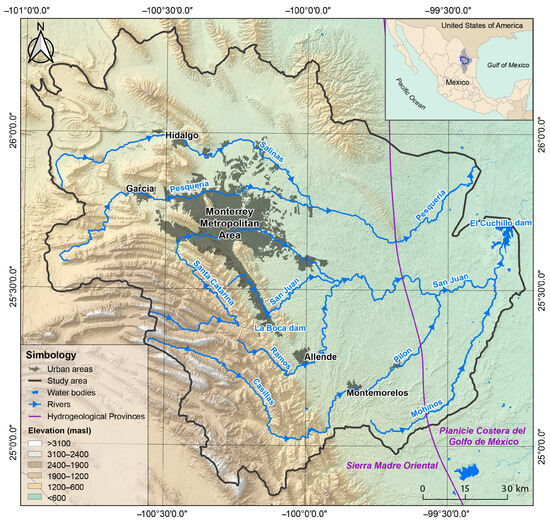
The study area, covering 17,209 km2 (6644 sq miles) primarily extends across the Nuevo León state and includes a smaller portion of Coahuila state in Northeastern Mexico (Figure 1). The boundaries of the study area were delineated based on topographic, morphological, and hydrological criteria, including the watersheds that encompass the MMA aquifer. This approach was chosen regardless of political or administrative boundaries to ensure a comprehensive understanding of the relevant hydrodynamics.Figure 1. Location of the study area showing the elevation (masl) and drainage network of the region. The purple line separates the Sierra Madre Oriental and Planicie Costera del Golfo de Mexico hydrogeological provinces. Dark gray polygons indicate urban areas.The MMA is classified as arid to semi-arid, with an average annual rainfall of less than 500 mm [61]. According to data from the National Institute of Statistics and Geography (Instituto Nacional de Estadística y Geografía—INEGI, Aguascalientes, Mexico), the MMA—comprising 18 municipalities—experienced substantial population growth from 2.7 million inhabitants in 1990 to more than 5.8 million in 2023, representing an average annual growth rate of 2.3% over the period [10]. This rapid population increase is primarily driven by sustained economic growth, industrialization, and accelerated urbanization, as the MMA has consolidated its role as a major economic hub in Mexico and Latin America.2.2. Regional Geology, Stratigraphy, and Hydrogeological Setting
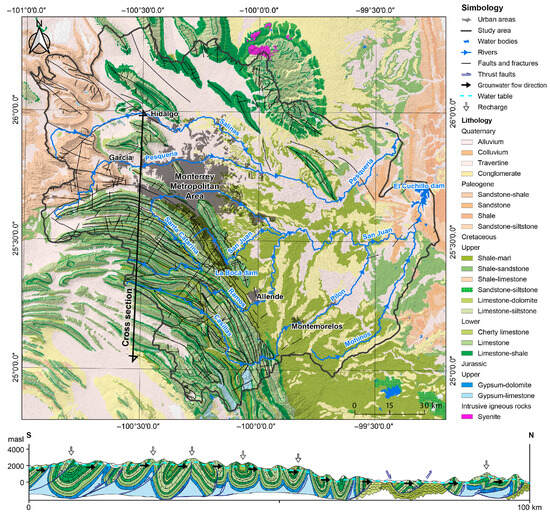
The physiographic, structural, and stratigraphic configuration of northeastern Mexico reflects a complex geological evolution initiated during the Triassic, including the assembly and breakup of Pangea, development of a passive continental margin, and deformation associated with the Laramide Orogeny [62,63,64] (Figure 2). These processes influenced sedimentation patterns and produced a thick succession of Jurassic to Eocene marine sedimentary rocks—carbonates and siliciclastics—overlying a heterogeneous Precambrian crystalline basement [65]. Carbonate sedimentation dominated much of the Jurassic and Cretaceous, while evaporitic deposits formed locally under restricted marine and lagoonal conditions. During the Quaternary, erosion of uplifted ranges led to extensive deposition of alluvial and colluvial sediments in valleys [66].Figure 2. Above: Geological map of study area showing lithological units, major faults and fracture systems, together with surface hydrological features and urban areas. Below: Vertical geological section showing lithological units and major faults.Stratigraphically, the sequence begins with Upper Jurassic evaporites and carbonates of the Olvido and Zuloaga Formations, composed of gypsum and dolomite interbedded with thin shale horizons, followed by mixed siliciclastic–carbonate units such as La Casita Formation consisting of coarse conglomerates at the base, grading upward into sandstones and fossiliferous shales. Lower Cretaceous sedimentation is dominated by thick carbonate platforms (Taraises, Cupido, Aurora Formations), interbedded with shale-rich formations (Carbonera, La Peña, Cuesta del Cura, Kiamichi Formations). Upper Cretaceous units include alternating limestones and shales (Eagle Ford Group, Indidura, Agua Nueva, Austin, San Felipe Formations), thick siliciclastic successions (Parras Formation, Difunta Group), and the Méndez Formation, the youngest marine unit. Paleocene–Eocene deposition shifted toward siliciclastic-dominated continental to marginal marine environments (Midway, Carrizo, Big Ford Formations, El Pico Clay). Neogene and Quaternary deposits consist mainly of conglomerates, alluvial sediments, travertines, and colluvial materials, which locally host shallow aquifers [15,67,68,69].Structurally, the region is characterized by intense deformation related to the Laramide Orogeny, producing narrow, elongated anticlines and synclines with predominant NW–SE to N–S orientations, particularly within the Sierra Madre Oriental (SMO) (Figure 2). These structures are locally disrupted by reverse, strike-slip, and later normal faults developed during the Neogene, which created tectonic basins subsequently filled with granular sediments [70,71]. Although deformation is widespread, its hydrogeological impact varies spatially, with intense folding affecting primarily Upper Cretaceous units such as the Méndez Formation [14].Hydrogeologically, the study area lies within the transition between the SMO and the Gulf of Mexico Coastal Plain [72] (Figure 2). The SMO hosts deep, confined aquifers developed in fractured and locally karstified but highly fractured and faulted Cretaceous carbonate sequences, bounded by shale-rich Jurassic and Upper Cretaceous units that act as regional aquitards. Groundwater flow and recharge are strongly controlled by lithology, folding, and fracturing, with high-yield wells commonly located along anticline flanks, supplying a significant portion of the MMA’s water demand. In contrast, the Gulf Coastal Plain is characterized by shallow, predominantly unconfined aquifers developed within Cenozoic sand, silt, and gravel deposits, where granular media favor groundwater storage and transmissivity.Administratively, 14 aquifers have been identified by the National Water Commission (CONAGUA) within the study area [17,18,19,20,21,22,23,24,25,26,27,28,29,30], where groundwater occurs mainly in two hydrogeological media: shallow unconfined aquifers in granular deposits and deeper confined aquifers in fractured carbonate rocks. Their hydraulic behavior is governed by structural controls, recharge at higher elevations, and the distribution of confining units that regulate regional groundwater flow.2.3. AHP Procedure
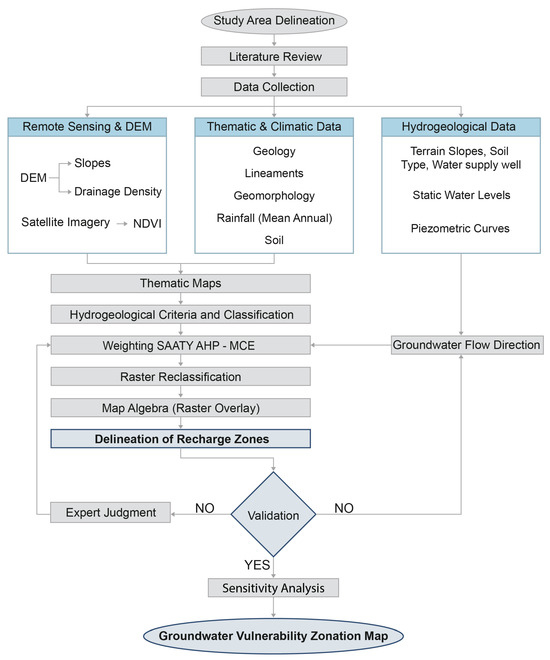
The AHP was employed to integrate MCE with RS and GIS techniques for delineating groundwater recharge areas within the MMA watershed. It was implemented according to the following steps, illustrated in Figure 3:Figure 3. Flow diagram for the delineation of recharge zones and vulnerable zones.
- 3.
- 4.
where ??? denotes the consistency index, ?max is the maximum or principal eigenvalue of the pairwise comparison matrix, and n is the order of the matrix.
where ??? is the Consistency Ratio, and ??? the consistency index of a randomly generated pairwise comparison matrix for different values of ?, as shown in Table 1:
Table 1. Consistency index for different values of ?.If ??? value is ?0.1, the inconsistency is considered acceptable; if ??? > 0.1, the pairwise comparison matrix should be revisited, and the judgement values should be carefully reassessed to account for the dominant factors influencing groundwater recharge.
- 5.
- 6.
where GWPI refers to the Groundwater Potential Index, Geo to geology, LD to lineaments, GM to the geomorphology of terrain, SP to slope, DD to drainage density, SL to soil type, LULC to land use and land cover, and PPT to precipitation (rainfall). The subscripts w and wi represent the weights and the NW of the thematic layers, respectively. This process allowed the assignment of groundwater potential to each pixel.
- 7.
- 8.
- 9.
- 10.
2.4. Selection and Weighting of Groundwater Recharge Influencing Factors
The presence and movement of groundwater are influenced by various geological, geomorphic, structural, and hydrological parameters [78]. Therefore, a comprehensive understanding is required to grasp the dynamics of groundwater systems. The selection of the parameters for this study was based on three specific criteria: (1) the influence of the parameter on groundwater recharge; (2) the use of the parameter in previous studies related to recharge; and (3) the availability of the parameter in the national cartographic database [45]. Based on the characteristics of the region and studies of other areas with similar environments, the factors influencing GWRZ were identified as: geology/lithology, structural lineaments, terrain slopes, geomorphology, precipitation, drainage density, NDVI, and soil types [73,74].A summary of the description of all the information layers is shown in Table 2.Table 2. Overview of map layers and their sources of information.Once the contributing variables to groundwater recharge were identified, pairwise comparison matrices were constructed. Each variable was scored on a scale from 1 to 9, following Saaty’s scale. Equations (1)–(4) were then used to evaluate the consistency of these matrices.The factors identified were analyzed to assess groundwater recharge in the MMA and were discretized into classes, which were weighted and integrated using the AHP framework.
2.5. Sensitivity Analysis
To evaluate the robustness of the groundwater recharge potential model and to assess the relative influence of the input criteria, a sensitivity analysis was conducted following a layer-removal approach, which has been widely applied in multi-criteria and GIS-based groundwater assessments [86,87,88].In this approach, the base model was recalculated by sequentially removing one thematic layer at a time while keeping the remaining criteria and their weights unchanged. The procedure was applied independently for the 1990 and 2022 scenarios, generating a set of alternative recharge potential maps for each period. Differences between the base and modified scenarios were quantified to identify the sensitivity of model outputs to each criterion.Model sensitivity was evaluated using four complementary indicators:
- (i).
where B? is the base map value at pixel k, R? is the removal scenario value, and K is the total number of valid pixels.
- (ii).
where Po is the proportion of observed agreement and Pe is the proportion of agreement expected by chance. This index is particularly valuable in spatial analyses because it considers the categorical structure of recharge classes rather than merely quantitative similarity [91].
- (iii).
where Var(B ? R?) is the variance of pixel-wise differences between the base and removal scenarios, and Var(B) is the total variance of the base map. This metric provides a variance-based quantification of each layer’s contribution to overall model uncertainty [93].
- (iv).
where K is the total number of pixels in the map or dataset, Bk the value of the k-th pixel in the predicted map or model output, Rk the value of the k-th pixel in the reference map or ground truth. Larger RMSE values indicate greater deviation from the baseline model, reflecting a stronger influence of the re-moved layer on model output.
To synthesize the results, all sensitivity metrics were normalized (r) and combined into a composite Sensitivity Score. Higher weights were assigned to SI and ? due to their robustness in spatial agreement analysis, while S and RMSE were assigned lower but complementary weights, as shown in Equation (9).????????????????????? ?????????=(0.30×?????)+(0.30×???)+(0.25×???)+(0.15×?????????)This integrated framework allows a comprehensive evaluation of spatial consistency, categorical stability, variance contribution, and deviation magnitude.3. Results and Discussion
3.1. Potential Groundwater Recharge Zones
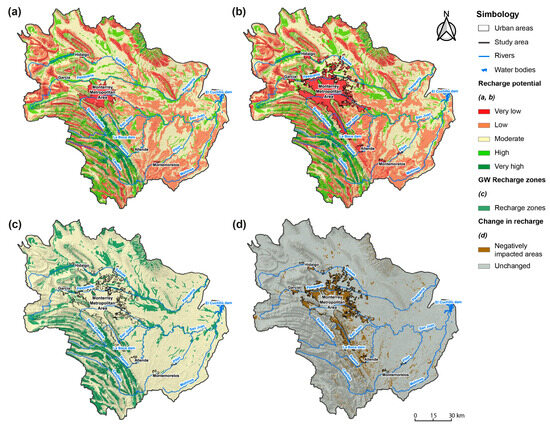
In this section, the results of the analysis of potential GWRZ are presented, using the Groundwater Potential Index (GWPI) calculated through weighted overlay analysis in a GIS. The analysis was conducted for the years 1990 and 2022 to assess changes in recharge zones over a 32-year period, identifying alterations and reductions attributed to land use changes and urbanization.The results indicate that by 1990, areas with very high recharge potential covered 719.9 km2 (4.2%), while high-potential areas covered 3219.5 km2 (18.7%), Moderate recharge potential zones represented 5905.2 km2 (34.3%), low-potential areas covered 5487.3 km2 (31.9%), and areas with very low recharge potential extended 1877.1 km2 (10.9%) (Table 3).Table 3. Spatial distribution of GWRZ potential classes for 1990 and 2022, showing absolute area (km2), relative area (%), and absolute and relative changes between both periods.By 2022, the spatial distribution had shifted considerably. Areas with very high recharge potential decreased to 619.5 km2 (3.6%), reflecting a reduction of 100.4 km2 (?13.9%). High-potential zones slightly increased to 3268.0 km2 (19.0%), gaining 48.5 km2 (+1.5%). In contrast, moderate recharge areas declined to 5079.7 km2 (29.5%), a loss of 825.5 km2 (?14.0%). Low-potential zones showed a slight decrease to 5343.4 km2 (31.1%), corresponding to a reduction of 143.9 km2 (?2.6%). Most notably, very low recharge potential areas expanded substantially to 2898.4 km2 (16.8%), increasing by 1021.3 km2 (+54.4%) (Table 3).The changes in the groundwater recharge potential between 1990 and 2022 are observed as an increase in reddish tones between Figure 4a,b. These tones are associated with an increase in areas with low and very low recharge potentials, as well as urbanization processes that caused changes in the geological, geomorphological, and edaphological cover, as well as changes in precipitation patterns. These changes are mainly observed near the MMA, but also in the southeast and southwest sectors of the study area, where the red colors predominate.Figure 4. (a) Map of potential GWRZ in 1990; (b) Map of potential GWRZ in 2022; (c) Groundwater recharge zones; (d) Change in recharge between 1990 and 2022.For the delineation of recharge areas, zones with high and very high recharge potential (Figure 4a) were identified and integrated into a single classification, defined as areas with actual groundwater recharge potential (Figure 4c). Based on a comprehensive analysis of overlapping maps using criteria such as geology, structural lineaments, geomorphology, precipitation, drainage density, slopes, NDVI, and soil types, it was determined that the recharge zones in the study area are primarily located in the southwestern sector, corresponding to the Sierra Madre Oriental region, as well as in the piedmont areas, where conditions for precipitation infiltration are more favorable (Figure 4c).Additionally, some recharge areas were identified in the northern and eastern regions of the study area, determined by their physical characteristics and the analysis of the eight criteria used.3.2. Method Validation
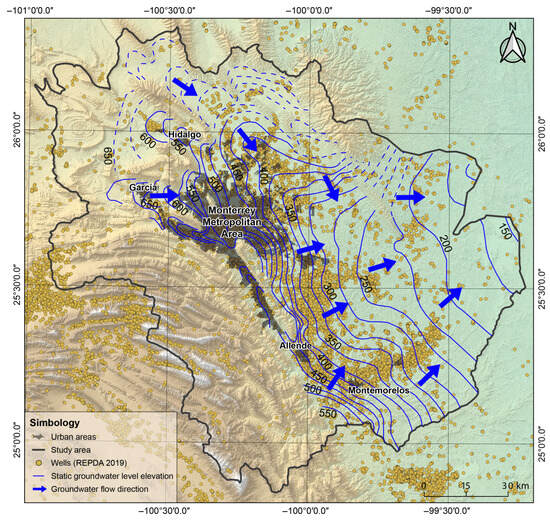
To validate the delineation of the recharge areas (Figure 4c), the spatial distribution of recharge classes was first compared with the regional geological framework. The analysis indicates that in 2022 the highest recharge potential areas are predominantly associated with: (1) Cretaceous limestones (49%) and (2) Quaternary alluvial sediments (42%).A second approach was conducted to validate the delineation of the recharge areas identified in this study, a second validation approach was applied, based on hydrogeological criteria. This involved analyzing the static groundwater level elevation map and flow directions reported by CONAGUA [20,21,22,23,24,25,26,27,28,29,30] to identify hydraulic gradients, piezometric highs, and inferred recharge–discharge relationships. The delineated high-recharge zones are spatially consistent with topographic and piezometric highs, whereas discharge areas correspond to lower hydraulic heads and zones of concentrated groundwater abstraction. The well distribution was taken from the 2019 Public Register of Water Rights (REPDA—Registro Público de Derechos del Agua) database [95] (Figure 5).Figure 5. Regional groundwater flow directions in the study area and water well distribution according to REPDA database [95].Overall, the application of this second hydrogeological validation strategy provided additional and independent support for the robustness of the GWRZ delineation, increasing confidence in the spatial reliability of the recharge potential assessment.3.3. Sensitivity Analysis
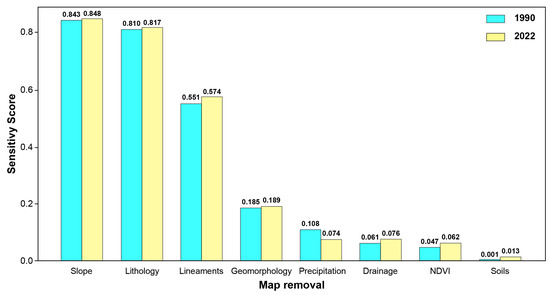
The sensitivity analysis reveals that the groundwater recharge potential model is moderately to highly sensitive to terrain- and geology-related criteria, while surface-related parameters exert a comparatively lower influence (Figure 6). For both 1990 and 2022 scenarios, the removal of slope and lithology produced the largest deviations from the base model, as reflected by the lowest SI and ? values and the highest Sobol indices (Section S3, Supplementary Materials).Figure 6. Integrated sensitivity score and temporal evolution of layer importance (1990–2022).Slope consistently showed strong sensitivity, highlighting its dominant control on runoff–infiltration partitioning and recharge spatial patterns, in agreement with previous groundwater recharge studies in semi-arid and urbanizing regions [96,97]. Lithology exhibited the highest contribution to total model variance, confirming the fundamental role of subsurface hydraulic properties in governing recharge processes.Structural lineaments showed moderate sensitivity, suggesting a secondary but non-negligible control related to preferential flow paths. In contrast, criteria such as soil type and NDVI resulted in relatively small changes in recharge class distribution when removed, indicating a lower influence on the overall spatial variability of recharge potential at the regional scale.3.4. Changes Between 1990 and 2022
Comparing recharge potentials between 1990 and 2022, the area of zones classified as very low groundwater recharge potential increased by 1021.3 km2 (+54.4%) and 100.4 km2 (?13.9%) (Table 3).Overall, approximately 1121.7 km2 of the study area experienced a negative shift in recharge potential, indicating a net transition from higher to lower recharge categories over the 1990–2022 period. This area corresponds to ~6.5% of total area, is slightly larger than Hong Kong and substantially larger than the land area of New York City.To quantify the volume of water recharge or water loss by changes in land use, further studies are needed, including field activities such as well censuses and sampling of groundwater and surface water for geochemical and isotopic analysis. Additionally, using specialized tools for recharge calculations would be beneficial.3.5. Vulnerable Zones in the MMA
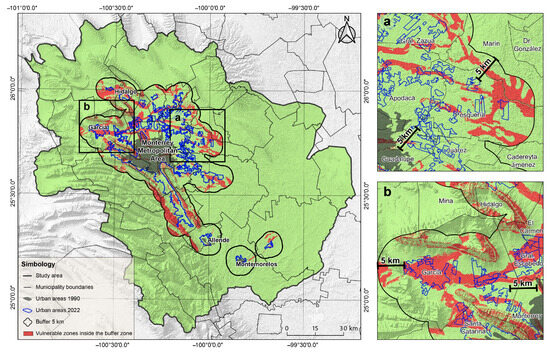
Vulnerable zones refer to recharge areas whose infiltration capacity could be compromised due to urban expansion and land use changes, highlighting the need for protection strategies to ensure the sustainability of groundwater resources. According to the United States Environmental Protection Agency (USEPA), these areas are also exposed to additional risks, such as chemical accidents at nearby industrial facilities.In the MMA, identifying these zones is crucial for land-use planning that prioritizes aquifer protection. This study aims to guide urban development toward less impervious areas while preserving those with very high infiltration potential to maintain natural groundwater recharge processes.To identify vulnerable zones, the territorial expansion of the MMA from 1990 to 2022 was analyzed. It was observed that this expansion corresponds to approximately a 5 km buffer around the urban areas. Based on this and considering official projections indicating continued dispersed urban expansion toward 2040 [77] a 5 km buffer was applied around the 2022 urban extent to represent plausible future growth scenario over the next ~30 years.This buffer also includes municipal boundaries, enabling the identification of vulnerable zones within each municipality, both within the MMA and near its boundaries. Figure 7 shows the vulnerable zones, identified within the buffer zone, with focus on northwest and northeast of the MMA.Figure 7. Vulnerable zones inside the buffer zone, with focus on northeast (a), and northwest of the MMA including municipalities (b). Focus areas in the south are not shown.From this analysis, it can be concluded that the municipalities with the largest territorial coverage of vulnerable zones are Santiago, Monterrey, Pesquería, General Escobedo, El Carmen, and Hidalgo (Figure 7). These vulnerable zones require targeted conservation measures to maintain infiltration and groundwater recharge processes. This approach not only helps decision-makers safeguard groundwater resources but also promotes awareness within local communities about the critical importance of protecting these areas for long-term water sustainability.3.6. Limitations and Future Work
This study presents a qualitative assessment of groundwater recharge potential based on a multi-criteria evaluation approach. While this methodology allows for a spatial identification of zones with differing recharge potentials—as well as areas where high recharge potential is threatened by urban and industrial expansion—several limitations should be acknowledged. First, the analysis relies on qualitative outputs; quantifying actual recharge volumes was beyond the scope of this work. Additionally, the study faced constraints related to the availability, quality, and temporal resolution of publicly accessible datasets. Many governmental datasets are outdated or incomplete, which may introduce uncertainty into the results. Field validation activities could not be conducted, limiting the ability to confirm on-site conditions such as soil permeability, vegetation cover, infiltration capacity, geological and structural surveying, and hydrogeologic heterogeneity.Another key limitation is that the temporal comparison was restricted to two benchmark years—1990 and 2022. Although these years provide insight into long-term change, analyzing additional years or multi-year periods would provide a more robust understanding of temporal variability and trends, particularly in relation to climate fluctuations, land-use transitions, and interannual hydrological dynamics. Incorporating continuous or decadal time series would significantly strengthen the reliability of observed recharge changes and better capture gradual or episodic shifts.Despite these limitations, this study provides a valuable first approximation for delineating groundwater recharge zones and identifying areas vulnerable to future land-use pressures. To refine the understanding of recharge processes, future work should include field-based investigations such as water-use censuses, geochemical and isotopic analyses of groundwater and surface water, geological and structural field surveys, and the application of methods such as the soil water balance model or the development of a numerical groundwater flow model.Strengthening the integration of high-resolution datasets, updated geospatial information, and hydrological monitoring—combined with expanded temporal analysis—will enable more precise quantification of recharge and more accurate projections of how urban expansion may affect groundwater systems. Ultimately, strengthening the understanding of recharge mechanisms will enable more sustainable water-management strategies and support decision-makers, communities, and water users in safeguarding groundwater recharge areas as fundamental elements of the regional hydrological cycle and as strategic resources sustaining essential economic activities.4. Conclusions
This study evaluated the evolution of groundwater recharge zones in the Monterrey Metropolitan Area between 1990 and 2022 using an integrated GIS–Multi-Criteria Decision-Making framework supported by sensitivity analysis. The results reveal a clear redistribution of recharge potential over the 32-year period, characterized by a substantial expansion of very low recharge areas and a reduction in high recharge zones. Overall, more than 1100 km2 experienced degradation in recharge potential, largely associated with sustained urban expansion and land-use change.Sensitivity analysis confirms that lithology and slope exert the strongest control on recharge patterns, underscoring the dominant role of geological structure and topographic gradients in regulating infiltration processes. Although climatic variability influences recharge, the spatial configuration of observed changes indicates that urban growth and surface sealing are the primary drivers of recharge decline within the study period.The progressive encroachment of urban areas into high-recharge zones increases groundwater vulnerability, reduces natural infiltration capacity, and heightens long-term water-security risks. Protecting remaining high- and very high-recharge areas should therefore become a central element of regional planning strategies. Integrating recharge mapping into land-use regulation, zoning policies, and nature-based or managed aquifer recharge initiatives will be essential to enhance groundwater resilience under continued urbanization, climatic uncertainty, and growing binational water obligations.Supplementary Materials
The following supporting information can be downloaded at: https://www.mdpi.com/article/10.3390/w18050616/s1, Figure S1: Thematic maps 1990; Figure S2: Thematic maps 2022; Figure S3: Spatial distribution of groundwater recharge potential areas across base and layer-removal scenarios; Figure S4: Temporal evolution of groundwater recharge potential classes between 1990 and 2022; Figure S5: Percentage change in groundwater recharge potential classes relative to the base scenario for 1990 and 2022; Figure S6: Comparative global and spatial sensitivity metrics for all criteria layers; Table S1: Pairwise comparison matrix of 8 groundwater potential recharge factors for the AHP model; Table S2: Weights and weightings assigned for the AHP approach for each factor; Table S3: Area (km2) of groundwater recharge potential classes for the base model and layer-removal scenarios (1990 and 2022); Table S4: Global and spatial sensitivity metrics derived from the layer-removal analysis (1990 and 2022).Author Contributions
Conceptualization, D.A.-P. and J.M.; methodology, D.A.-P., L.R. and R.L.-R.; software, R.L.-R.; validation, D.A.-P., R.S. and J.M.; formal analysis, L.R., M.M.V.d.C. and R.L.-R.; investigation, L.R., M.M.V.d.C. and R.L.-R.; resources, J.M.; data curation, L.R., D.A.-P. and D.K.N.-F.; writing—original draft preparation, D.A.-P. and R.L.-R.; writing—review and editing, R.S., J.M., D.K.N.-F., D.A.-P., L.R. and R.L.-R.; visualization, R.L.-R. and D.K.N.-F.; supervision, J.M. and R.S.; project administration, D.A.-P.; funding acquisition, R.S. All authors have read and agreed to the published version of the manuscript.Funding
This research was funded by the Permanent Forum of Binational Waters and Terra Habitus A.C (no funding number was assigned). The APC was funded by Tecnologico de Monterrey.Data Availability Statement
The original contributions presented in this study are included in the article/Supplementary Materials. Further inquiries can be directed to the corresponding authors.Acknowledgments
The authors acknowledge the support from Terra Habitus and the Permanent Forum of Binational Waters to develop this study. The authors used a generative artificial intelligence tool (Chat GPT 5.3) to assist with improving the clarity and English language of the manuscript. The AI tool was used only for language editing purposes. All scientific content, interpretation, and conclusions were developed and verified by the authors, who take full responsibility for the final manuscript.Conflicts of Interest
The funder of this study had no role in the design of the study; in the collection, analyses, or interpretation of data; in the writing of the manuscript; or in the decision to publish the results. R.S. serves as a guest editor for the Special Issue on Working Across Borders to Address Water Scarcity. The review process and all editorial decisions were conducted independently of this author and were managed by an editor who is not among the Guest Editors.