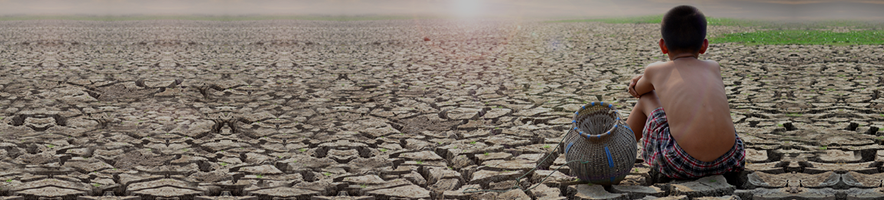
How Much Water Did Iran Lose Over The Last Two Decades? May 4th, 2022
Via Science Direct, a new study on Iran’s water and recent losses:
Highlights
Iran has lost about 211 ± 34 km3 of its total water storage over the last two decades.
Relative to 1983–2002, Iran has gained precipitation at the rate of 4.9 ± 0.02 km3/yr.
Despite overall gain, 11 basins have been in water deficit since 2007.
Within 2003–2016, the groundwater level has dropped significantly (?28 ± 1.4 cm/yr).
Our results raise critical issues regarding unsustainable water management in Iran.
Abstract
Study area
Iran.
Study focus
Iran, once a pioneer of sustainable water management, is currently facing water bankruptcy. Aggressive exhaustion of non-renewable water has led to a suite of environmental and socio-economic problems across the country. Nevertheless, the understanding of Iran’s water loss is still incomplete due to a lack of conclusive data. In this study, we employ satellite gravimetry observations, in-situ and globally precipitation data, and gauged groundwater level to investigate the total water storage (TWS) loss in Iran over the last two decades.
New hydrological insights for the region
We quantify Iran’s water loss using a data-driven approach supported by a Monte-Carlo simulation. Our analysis indicates TWS loss of 211 ± 34 km3 (> twice Iran’s annual water consumption) within the 2003–2019 period. The mean groundwater level has dropped significantly at a rate of ? 28 ± 1.4 cm/yr. This tremendous water loss happened despite an overall increased relative precipitation rate of + 4.9 ± 0.02 km3/yr. Thus the TWS loss can only be explained by drastic overexploitation of non-renewable water resources. Two major extreme events occurred during the study period, namely the 2007 drought and early 2019 floods. The former resulted in a total 115 ± 0.6 km3 water loss, one-third of the long-term annual precipitation. Approximately the same amount was brought back by a series of extreme precipitation events leading to floods in early 2019. Our results raise critical issues regarding unsustainable water management in Iran and highlight the crucial role of spaceborne measurements for understanding short-term and long-term water availability change in the absence of sufficient ground data.
The observed depletion of water resources is the product of frequent meteorological droughts (natural variability), climatic changes, and human activities (increased water use and withdrawal). However, many studies consider anthropogenic activities including population growth (increasing demand), inefficient agricultural water use, and unsustainable water resources management as the primary cause of Iran’s water bankruptcy (e.g., Madani, 2014, Madani et al., 2016, Mirnezami et al., 2018, Nabavi, 2018, Mirzaei et al., 2019, Maghrebi et al., 2020, Panahi et al., 2020). The quantitative knowledge of Iran’s water bankruptcy problem at the national scale is still very limited due to the lack of conclusive ground data. Filling this knowledge gap and developing a deep understanding of the level of water loss across Iran will be an essential step towards addressing this significant national problem.
Estimation of Total Water Storage (TWS), defined as the sum of all storage components such as surface water, soil moisture, snow water, and groundwater, provides valuable insight into the water resources availability at the regional scale (Syed et al., 2005, Riegger and Tourian, 2014, Tourian et al., 2018). Conventional ground-based measurements of TWS components, e.g., change in surface water storage (SWS), soil moisture storage (SMS), and groundwater storage (GWS) are being done at local scales. However, ground-based measurements are often associated with data inconsistencies, spatial, temporal and physical data gaps (e.g. unknown storage coefficients), and instrumental and human errors (Forootan et al., 2014, Rodell et al., 2007, Lorenz et al., 2015). Evaluation of TWS can also be done using Land Surface Models (LSMs) or hydrological models. The performance of these models, however, varies in different parts of the world which can make them unreliable for water management and decision-making purposes, especially during extreme events like droughts or floods (e.g., Long et al., 2013, Long et al., 2014, Felfelani et al., 2017).
The Gravity Recovery and Climate Experiment (GRACE) mission, launched in March 2002, caused a quantum leap in the hydrological understanding of continental-scale systems (Tapley et al., 2004). GRACE maps the time-variable gravity field by observing the relative motion between the centers-of-mass of two satellites, measured with a highly accurate inter-satellite K-band microwave link. For the first time, GRACE observations allow us to determine the continental water storage at monthly to inter-annual time scales, which was the ambition of hydrologists for a long time (Lettenmaier and Famiglietti, 2006). Therefore, GRACE has attracted considerable attention in the hydrology community (Wahr et al., 1998, Rodell and Famiglietti, 1999, Lettenmaier and Famiglietti, 2006). GRACE’s success necessitated a continuation and encouraged the launch of the GRACE Follow-On (GRACE-FO) mission in May 2018.
GRACE-TWS observations have been previously employed for water resources monitoring in Iran over the last two decades. Voss et al. (2013) reported an alarming loss at a rate of about 2.7 cm/yr in the north-central Middle East, including the Tigris and Euphrates River Basins and western Iran, from 2003 to 2009. A similar negative trend was also reported in Joodaki et al. (2014) over western Iran and eastern Iraq from 2003 to 2012. By subtracting contributions from soil moisture, snow, canopy storage, and river storage, groundwater depletion was found to represent approximately 60% of the total volume of water lost (Voss et al., 2013, Joodaki et al., 2014). Merging the Global Land Data Assimilation System (GLDAS) model and satellite altimetry data as a prior data with GRACE-TWS, Forootan et al. (2014) estimated a negative average trend of about 1.5 cm/yr over central and northwestern Iran during the 2005–2011 period. A recent study by Rahimzadegan and Entezari (2019) has shown that the trend values obtained from GRACE after removing soil moisture from GLDAS correlated well with the observed groundwater level variations in 4 sub-watersheds in Iran.
The aforementioned studies have assessed water loss in Iran over a short time period and did not include the GRACE-FO observations. Moreover, satellite gravimetric data have not been investigated together with groundwater level observations gauged via a country-wide dense network of piezometric wells. This study provides the first estimate of Total Water Storage Loss (TWSL) together with the uncertainty in Iran over the last two decades. The analysis incorporates the measurements of TWS from GRACE and GRACE-FO, precipitation from a dense network of rain gauges together with globally gridded datasets, and also groundwater level from piezometric wells. The results of our analysis are reported for the entire country and, for the first time, over its 30 major river basins. Our analysis shows significant TWSL over the whole country. Recently, the massive flood events in early 2019 took place in a large area of Iran (Yadollahie, 2019), which brought a considerable amount of water to the system. This study, for the first time, quantifies the contribution of these events to the TWS recover of Iran. Furthermore, using a dense network of piezometric wells, we quantify groundwater depletion as one of the leading representative indicators of anthropogenic activities and water bankruptcy.
2. The study region
Iran has an area of about 1.7million km2 and is located in the south-west of Asia (Fig. 1 (a)). The country’s main water bodies include the world’s largest (by area) inland water body called the Caspian Sea in the north, the Persian Gulf and the Sea of Oman in the south, and Lake Urmia in the northwest. Two large mountain ranges cover 60% of the area: the Alborz chain running from the northwest to the northeast along the southern edge of the Caspian Sea and the Zagros range, which runs from the northwest southward to the shores of the Persian Gulf. The central part of the country is covered by two large deserts: Dasht-e Kavir (about 77,600 km2) and the Lut Desert (Dasht-e Lut) (about 51,800 km2), which are the world’s 24th and 25th-largest deserts. Iran is divided into six main water basins, which are subdivided into 30 major river basins. The characteristics of the river basins are listed in Table 1. The first digit in the basin’s ID represents the number out of 6 major basins in Iran and the second indicates the sub-basins.
Table 1. Iran’s major river basins and their areas. Mean annual precipitation and discharge were calculated for each basin from ERA5 dataset for the period from 1983 to 2019.
ID
Name
Area
Mean annual
Mean annual
Empty Cell
Empty Cell
[103 km2]
precipitation [cm/yr]
discharge [cm/yr]
11
Aras
41
16.5
6.5
12
Talesh
7
51.5
50.9
13
Sefidrood
60
26.5
5.5
14
Haraz-Sefidrood
11
27.0
15.5
15
Haraz
19
31.0
18.5
16
Gharesoo
13
15.5
3.5
17
Atrak River
27
17.0
1.5
21
West-border
39
32.5
9.0
22
Karkheh
50
30.5
7.0
23
Karun
64
40.5
23.0
24
Jarahi and Zohreh
38
23.5
9.5
25
Helle
20
21.0
3.5
26
Mand
44
18.5
1.5
27
Mehran-Kal
58
13.5
1.0
28
Bandar Abbas
41
9.5
0.5
29
South Baluchestan
44
10.5
0.2
30
Lake Urmia
53
23.0
0.0
41
Namak Lake
91
19.5
2.0
42
Gavkhuni
40
13.0
0.4
43
Tashk
29
20.5
2.0
44
Abarghoo-Sirjan
54
11.0
0.2
45
Hamun-Jazmurian
64
10.5
0.5
46
Lut Desert
195
9.5
0.3
47
Central Desert
224
13.5
0.8
48
Siahkooh
47
6.0
0.3
49
Saghand
48
11.5
0.8
51
Khaf
32
12.5
0.8
52
Hamun Hirmand
3.2
4.0
0.2
53
Hamun Mashkel
3.3
8.0
0.2
60
Ghareghoom
44
20.5
3.0
In terms of climate, Iran is located in the subtropical high-pressure belt of the Earth. However, the variety of topographic regions, with heights varying from 25?m to 5600?m, has led to a wide range of climates across the country. Most of the country is arid (65%) to semi-arid (20%) with sweltering summers in the central and southern coastal regions, while only 15% is humid, mainly at regions close to the Caspian Sea and partly in areas close to the Persian Gulf and Sea of Oman (Madani, 2014) (Fig. 1 (d)). Using the data from Global Precipitation Climatology Centre (GPCC), the long-term (1960–2016) mean annual precipitation for the entire country is around 225?mm (~?370?km3), while precipitation can be as low as 50?mm/year in deserts and exceed 1500?mm/year in the northern side of the Alborz Mountain range and the coastal areas of the Caspian Sea (Fig. 1 (e)). In terms of annual precipitation, Iran ranked 158 among 189 countries over the 1960–2016 period using GPCC as the reference dataset. Around 30% of the total precipitation falls in the form of snow (Mousavi, 2005), but this share seems to be declining over the last decade (Araghi and Mousavi-Baygi, 2020). About 70% of the precipitation is lost through evaporation (Lehane, 2014).
3. Data
3.1. Precipitation
In this study, precipitation data from a dense network of 2850 stations covering 1983–2013 has been collected. Such a network is installed and maintained by Iran’s Meteorological Organization (IRIMO) and Iran’s Water Resources Management Company (IWRM). Fig. 1(c) illustrates the distribution of gauges throughout Iran. Continuous in-situ observations up to the end of 2019 are available only for a limited number of rain gauges (less than 400), which does not provide a desirably dense network of measurements. Therefore, we evaluate the performance of 10 gridded precipitation datasets that include observations from 1983 to the end of 2013 over Iran’s basins (Table 2). The datasets perform inconsistently over different regions (Saemian et al., 2021). The discrepancies in performance might arise due to the diverse climate of Iran and the inhomogeneous distribution of rain gauges (see Fig. S7). Thus, at each basin, we assess the performance of these datasets using the in-situ observations and select the best group of them (see Section 4.2 for more details). The ensemble mean of the selected datasets at each basin is then used for calculating the long term monthly mean (1983–2002) and precipitation anomaly over the study period (2003–2019).
Table 2. Summary of global precipitation datasets. Abbreviations in the data source(s) defined as: G, gauge; S, satellite; and R, reanalysis.
To compute the reference in-situ dataset, we first perform quality control and homogeneity tests for all the stations. The four tests namely the Buishand range test (Buishand, 1982, the Von Neumann ratio test (Von Neumann, 1941), the standard normal homogeneity test (SNHT) (Alexandersson, 1986) and the Pettit test (Pettit, 1979) are used to check the homogeneity. In order to identify the inconsistencies, we have applied the double mass curve test (Searcy and Hardison, 1960). The above-mentioned tests are described in Section 1 of the Supplementary materials. Based on the aforementioned tests, we have excluded 19 stations from our assessments. The remaining stations do not show data outages within 1983–2013. During this period, at each month, we average gauge values for each 0.5? ×?0.5? grid cells. In order to reduce the uncertainty from gauge measurements, only grid cells containing at least three gauges are considered in the estimation (Adler et al., 2003, Xue et al., 2013). Please see the distribution of cells with and without data in Fig. S4. Two basins, 47 and 46, suffer from sparsity of gauged cells. These spatial gaps are located at two large deserts: Dasht-e-Kavir and the Lut Desert (described in Section 2), where we expect limited precipitation variation. Therefore, the gauged cells of these two basins can be generalized to the whole basin.
The gridded datasets are classified into three classes: gauge-based, satellite-based, and reanalysis products (see Table 2). All gridded precipitation datasets are re-sampled to 0.5? ×?0.5? using nearest-neighbor interpolation to be consistent with the gridded data from ground data. All datasets have been briefly introduced in Section 2 of the Supplementary material.
3.2. Groundwater level data
This study relies on the groundwater observations of 13,879 piezometric wells from IWRM (http://wrs.wrm.ir/amar, last access 20 April 2020), with the most updated available data up to June 2017 (Fig. 1(b)). We selected the wells covering 2003–2016 with less than 12 months gap. Well observations after 2016 were not available at the time of writing the paper. We first apply quality control and eliminated outliers and biases for each group of wells within their corresponding aquifer. To fill the gaps, we use spline interpolation. In order to estimate the time series of mean groundwater level anomaly (GWLA) at each basin, the time series of GWL at each well is standardized using its mean and standard deviation. The standardization enables us to merge wells that carry different properties (Tourian et al., 2015). Then, in each aquifer, we calculate the ensemble mean of all standardized levels and multiply the obtained time series by the average of the well’s standard deviations before standardization. Finally, to determine the time series of mean groundwater level anomaly and the corresponding uncertainty at each basin, we have employed the weighted least squares estimation, using the area of the aquifers as the weights. The method is depicted schematically in two main steps in Fig. S8.
3.3. GRACE and GRACE Follow on
We use satellite gravimetry to track Total Water Storage Anomaly (TWSA). We use the GRACE and the GRACE-FO level 02 spherical harmonic coefficients up to degree and order 96 from ITSG-Grace2018 which is the latest gravity field model computed by he Institute of Geodesy at Graz University of Technology (ITSG), Graz (Mayer-Gürr et al., 2018). Kvas et al. (2019) have shown that the time series from ITSG-Grace2018 is consistent with the current release (RL06) of the official GRACE processing centers CSR, GFZ, and JPL. Moreover, ITSG-Grace2018 slightly outperforms the official solutions in the noise of mid-to-high degrees spherical harmonics. The data covers the period from January 2003 to the end of 2019 with a gap of about one year (July 2017–May 2018), which is the gap between GRACE and the GRACE-FO. The degree 2 and order 0 coefficient (C20) in these GRACE fields is replaced by the C20 coefficient derived from Satellite Laser Ranging (SLR) solutions (Cheng et al., 2013). In order to account for the change in the Earth’s center of mass, the degree-1 coefficients are replaced according to Swenson et al. (2008). To calculate geoid anomalies, we remove the long-term (2004–2010) mean of spherical harmonics as an estimation of the static gravity field. Due to the correlated colored noise in the level 02 products, we use a Gaussian filter of radius 400?km for filtering (Devaraju, 2015). The smoothing causes damages to the signal via leakage (e.g., Chen et al., 2006, Klees et al., 2008). To mitigate this issue, we apply the data-driven method of deviation proposed by Vishwakarma et al. (2017), which has been shown to restore the lost signal to a large extent for small catchments. Finally, the TWSA time series are calculated for Iran and its 30 major river basins at monthly steps (see Fig. S2). GRACE measurement suffers from gaps mainly after 2011 (22 months in total). To fill these gaps, we have employed spline interpolation for the time series of each basin (Bibi et al., 2021, Tourian et al., 2021).
The uncertainty is obtained by the conventional error propagation of the full error variance-covariance matrices provided by ITSG (Wahr et al., 2006). It should be noted that basins in the coastal regions in the north of Iran are still prone to leakage and the leakage correction would not guarantee to remove all leakages. This happens due to the strong negative signal from Caspian Sea. Several studies have investigated the challenge of small-scale GRACE applications (e.g., Longuevergne et al., 2010, Huang et al., 2015). Fig. S2 compares the result from the post-processing proposed in this study with the CSR mascon RL06 version 2. In general, in all catchments, the TWSA estimation follows two mascons products well. The correlation between the time series used in this study and the mascons are provided in each basin. Moreover, We have compared TWSA using the official GRACE processing centers CSR, GFZ, and JPL with ITSG-Grace2018 in Fig. S6.
4. Methodology
4.1. Trend analysis
The long-term behavior of TWSA and GWLA time series over Iran and many of its basins are not necessarily represented by a linear trend (cf. Fig. 2, Figs. S2, S5). TWSA time series experienced a new equilibrium level after the 2007 drought (Tourian et al., 2015. Moreover, the floods in 2019 increased the TWS leading to a positive effect on TWSA time series. A linear trend via least-squares fitting fails to capture its non-linearity especially for the weak positive trend observed from early 2019 onwards (see Fig. S3). Therefore, to quantify the water loss (or gain) from the TWSA and groundwater level anomaly, we need to extract the nonlinear trend of the time series. Fig. 2 (a) presents the time series of the TWSA over Iran within the study period with its uncertainty shown as gray envelope. We obtain the long-term nonlinear signal using the Singular Spectrum Analysis (SSA) with a 2-year window. The 2-year window results in the minimum linear trend left in the seasonal signal after removing the SSA non-linear trend (see Fig. S9). SSA is a model-free nonparametric time series analysis method that decomposes a time series into interpretable components (Blewitt and Lavallée, 2002). However, the SSA method does not deliver any uncertainty for the estimated non-linear trend. Therefore, to obtain a realistic uncertainty, we perturb storage and groundwater time series according to their stochastic information using a Monte-Carlo simulation (Mooney, 1997, Metropolis and Ulam, 1949). To perturb, we assume a normal distribution for each monthly value (see Fig. S11), centered at the signal with the estimated uncertainties (Sections 3.2 and 3.3) as its standard deviation. We then simulate 10,000 realizations of the time series to acquire a comprehensive representation of all possible realizations (Fig. 2 (b)). Then, for each realizations we apply SSA to obtain the non-linear trend (Fig. 2 (b)).
If we consider the study region as a bucket, we can estimate the total water loss or gain from each of the non-linear realization by subtracting the last value from the first value (Fig. 2 (c)). To calculate the average annual rate of water loss or gain, we divide the result from subtraction by 17 years, which corresponds to the total number of years in the study period (2003–2019). The TWSL from all realizations form a normal distribution according to the Monte-Carlo-Simulation assumption (see the bottom left of Fig. 2 (c)). Finally, the mean of all 10,000 realizations would be the representative TWS loss or gain, and their three standard deviation would be its uncertainty.
4.2. Precipitation analysis
We quantify relative gain or deficit in precipitation within the past 17 years (2003–2019). Gain (deficit) is considered to be the precipitation higher (lower) than a reference, which is defined as the long-term monthly mean from 1983 to 2002. To this end, we first analyze the datasets to nominate the most reliable precipitation data of each basin. As error measure at each basin, we subtracted the monthly gauged precipitation throughout 1983–2013 from the corresponding values in the gridded precipitation datasets. Saemian et al. (2021) showed that the pixel-to-pixel comparison (the method used in this study) and the alternative approach of evaluating errors at gauges (called point-to-pixel) result in the same ranking among datasets in Iran. It should be noted that to calculate the monthly values from precipitation datasets, at each basin we have included only the grid cells with measurements in the in-situ dataset (colored cells in Fig. S4). To evaluate the results, we do not rely on any standard metric like Nash-Sutcliffe, Root Mean Square of Errors (RMSE) or bias as they provide only a summary rather than a full view of the error. Instead, we look at the whole distribution of the error which allows us to evaluate errors in all quantiles. The errors contain both negative and positive values and are typically biased and not-centered at zero. We fold the error over its median, referred to as over median folded error (OMFE), and then build its Cumulative Distribution Function (CDF). Fig. 3 (b) shows the CDF of 10 precipitation datasets over the Lake Urmia basin. They perform similarly, with 55–70% of the OMFE below 10?mm.
At each basin, we select the precipitation datasets with OMFE at 90th percentile less than 15% of the mean annual precipitation of the basin, with the mean taken from GPCC (see Fig. 3 (b)). The selected datasets are shown in Fig. 3 (a). For each basin, we calculate the ensemble mean and its corresponding uncertainty of the selected datasets using the weighted least squares method. The OMFE values at 90% quantile from the selected datasets are employed as their weight in the weighted least squares adjustment.
We quantified water input stability at each basin by the precipitation anomaly ?P(ty,m) for the period of 2003–2019 with respect to its climatology (long-term monthly mean (1983–2002)):δP(ty,m)=P(ty,m)−120∑y=19832002P(ty,m),” role=”presentation” style=”box-sizing: border-box; margin: 0px; padding: 0px; display: inline-block; line-height: normal; font-size: 16.2px; word-spacing: normal; overflow-wrap: normal; white-space: nowrap; float: none; direction: ltr; max-width: none; max-height: none; min-width: 0px; min-height: 0px; border: 0px; position: relative;”>where P is the precipitation, ty,m represent the discrete time, month (m) varying from 1 to 12 and year (y) varying from 1983 to 2002. The anomalies ?P(ty,m) represent the gain or deficit in precipitation at each month relative to the long-term monthly mean. We then obtain the long-term mean annual anomaly by:δP¯=117∑y=20032019∑m=112δP(ty,m).” role=”presentation” style=”box-sizing: border-box; margin: 0px; padding: 0px; display: inline-block; line-height: normal; font-size: 16.2px; word-spacing: normal; overflow-wrap: normal; white-space: nowrap; float: none; direction: ltr; max-width: none; max-height: none; min-width: 0px; min-height: 0px; border: 0px; position: relative;”>
5. Results
Fig. 4 (a) presents the time series of GRACE TWSA over Iran from 2003 to 2019. The time evolution of the TWSL relative to the initial epoch is shown in Fig. 4 (b). The larger uncertainties around 2015 and 2017 are related to the battery issue at the end of the GRACE mission. The TWS exhibited a weak positive trend from 2003 to 2005, which brought about 23?km3 water to the system. The short-lived positive trend in TWS was followed by a continuous negative trend from 2006 to 2016, triggered by the drought in 2007, during which Iran has lost about 256?km3 water, corresponding to a rate of about ??23.25?km3/yr. The negative trend ended in early 2017 and TWSA showed a weak positive trend from 2017 to the end of 2019. Within 2017–2019, TWS gained about 31?km3 at a rate of about +?10.3?km3/yr. Overall since 2003 Iran has lost 211?±?34?km3 of its TWS at an average rate of about ??12?±?2?km3/yr. This water amount corresponds to about half of Lake Erie’s volume (https://www.epa.gov/greatlakes/physical-features-great-lakeswww.epa.gov), one of the Great Lakes in North America.
Moreover, Least Squares Spectral Analysis (LSSA) method (Wells et al., 1985) revealed that the annual amplitude amounted to 7.4?cm over the study period (2003–2019), which represents 122?km3 of water. The annual TWS variation has not remained constant within the last two decades and has followed three main phases, i.e., from 2003 to 2007 with 8.5?cm, from 2008 to 2015 with 7.4?cm, and finally from 2016 to 2019 with 9?cm. The smaller annual variation throughout 2008–2015 is mainly driven by a continuous decrease in the precipitation (cf. Fig. S1 and Fig. 4). Given a normal situation without drought or flood periods, the annual TWS variation seems to vary within 8.5–9?cm (140–148?km3).
The basin-wise distribution of the TWSL rates and relative precipitation gain or deficit in Iran over the last 17 years (2003–2019) are shown in Fig. 5 (a) and (b), respectively. Fig. 5 (a) presents the result of both rates of TWSL in terms of water height (colors) and volumetric (circular disks). All major basins suffer from a significant water loss within 2003–2019, varying between ??0.07 and ??1.8?km3/yr. The maximum TWSL rate has occurred in the Central Desert (47) at a rate of ??1.8?±?0.26?km3/yr, followed by Namak Lake (41), Lut Desert (46), and Sefidrood (13), each at a rate of more than ??1?km3/yr. Ghareghoom (60) in the southeast of Iran has experienced the minimum water loss (??0.07?±?0.05?km3/yr). Due to the inevitable post-processing process described in Section 3.3 and the coarse spatial resolution of GRACE (e.g., Rowlands et al., 2005, Longuevergne et al., 2010, Lorenz et al., 2014, Vishwakarma et al., 2018), the final results carry uncertainties and errors. Therefore, GRACE observations should not be over-interpreted, especially in small catchments like Talesh (12) or Haraz-Sefidrood (14).
It is noteworthy that for the same period, the water input reflects a different picture Fig. 5 (b). Relative to climatology, the water resource system has gained water from precipitation at a total rate of +?10.28?±?0.03?km3/yr in 17 basins (about 54% of the area), while in the 13 other basins (about 46% of the area) the total rate is ??5.42?±?0.03?km3/yr. Overall, the whole country has gained water from precipitation at the rate of +?4.86?±?0.02?km3/yr. The Karun basin (23) has experienced the maximum amount of gain at a rate of +?1.87?±?0.25?km3/yr while the adjacent Karkheh basin (22) shows the maximum deficit at a rate of ??1?±?0.11?km3/yr. Generally, these results are mirrored by in-situ observations shown in (Fig. 5 (d)). The discrepancies in some basins like 23, 43, 60, and 13 can be explained by the lack of sufficient in-situ gauge with long (covering 1983–2019) observations. We calculated the gain or loss at 380 gauge stations, gauged from 1983 to the end of 2019 with less than one-year data outages within 2003–2019. Gauge results match very well the gridded data sets (Fig. 5 (b)). The poor density of stations in the middle and eastern parts of the country is due to two vast deserts, namely the Lut Desert (46) and Central Desert (47) in the middle of the Iranian plateau.
Besides the TWS gain or loss, it is crucial to scrutinize how the water status evolved within 2003–2019. The drought event around 2007–2008 and the heavy rainfall in 2019 are two significant events that had a notable influence on the evolution (Fig. 6). Eleven basins with an area of about 40% of the country have remained in deficit after the 2007 drought including Karkheh (22), Lake Urmia (30), and Helle (25). In general, about 25% of the whole country (6 basins) including Lut Desert (46), Karkheh (22), and Hamun Hirmand (52) have never experienced a gain in the relative precipitation during 2003–2019.
Almost all basins underwent heavy rainfall in early 2019 (Fig. S1). Considering the long-term mean for the period 1983–2002 as the reference, the whole country gained around 115?±?0.8?km3 water in 2019. The Central Desert (47) received the maximum gain with about 1.04?±?0.05?km3 followed by the Namak Lake (41), the Mand (26), the Karun (23), and the Lut basin (46), all gaining more than 0.4?km3 water. Comparing Fig. 5 (b) and (c), such a heavy rainfall led to a change in the gain-deficit pattern in three basins (20% of the total area) namely Mehran-Kal (27), South Baluchestan (29), and the Central Desert (47). Moreover, significant changes in gaining or losing water status are observed in Karkheh (22), Karun (23), and Lut Desert (46) (cf. the last two sub-figures in Fig. 6).
To properly interpret the water loss from satellite gravimetry, we need to look at the mean annual precipitation gain or deficit from 2003 to 2019 relative to their climatology, determined within the reference period 1983–2002. Fig. 7 (a) shows gaining or losing water status in percentage representing alarming rainfall deficit in basins Hamun Hirmand (52), Khaf (51), and Helle (25) by more than ??10%. In the northern and central major basins, we observe a general gain by more than 10% of their mean annual precipitation. The percentage values of the total water loss with respect to the corresponding amplitude of the TWSA signal, trend-to-variability ratio, gives a sense how relevant the trend is with respect to the natural variability (Rahmstorf and Coumou, 2011, Lehmann et al., 2015). Considering the Root Mean Squared (RMS) of the TWSA as the amplitude, the trend-to-variability varies between ??8 and ??14% per year (Fig. 7 (b)).
All the obtained results are associated with uncertainties, which we have tried to address in this study. Fig. 8 (a) illustrates the rate of water loss together with their uncertainty. Despite their size the Lut Desert (46) and Central Desert (47) show high uncertainty, due to the weak signal which does not go beyond the GRACE noise level. The basin-wise gain or loss from precipitation and their corresponding uncertainty are shown in Fig. 8 (b). The gain or loss of five basins, namely Sefidrood (13), Mehran-Kal (27), South Baluchestan (29), Lake Urmia (30), and Central Desert (47), is undecided as their error bar contains the zero level.
It is remarkable that basins like Aras (11), Karun (23), Namak Lake (41), and Ghareghoom (60) have gained more than 1?km3 water while GRACE senses a negative trend. It should be noted that the GRACE estimates for small basins, like Aras (11), Talesh (12), Haraz-Sefidrood (14), Haraz (15), Gharesoo (16), and Atrak River (17) are prone to leakage. Such added uncertainty, however, will marginally affect the estimates of the trend. Since the water stored as surface water, soil moisture, canopy water and snow equivalent water is negligible in an arid to semi-arid climate of Iran (Abou Zaki et al., 2019, Van Camp et al., 2010), the negative trend in GRACE and simultaneous precipitation gain can only be explained by increased groundwater extraction. More than 90% of Iran’s water is allocated to the agricultural sectors and farming relies heavily on groundwater for irrigation (Madani, 2014). The number of wells in the time period 1971–2013 has dramatically increased from just over 47,000 to nearly 789,000 (Noor, 2017). Moreover, reliance on groundwater has increased steadily during droughts. It should be noted that in the basins with considerable soil moisture content like the coastal basins with humid climate and mountainous regions, the assumption of negligible surface water and soil moisture contribution to the TWS may not hold and needs to be investigated.
To quantify the drop rate of the mean groundwater level, we analyzed groundwater level data from the piezometric stations (Fig. 1 (b)). Fig. 9 represents the relative annual loss or gain rate of the groundwater level of the major basins in Iran, including their uncertainties. Given the unknown storage coefficients of aquifers, results are reported in cm as an absolute volume quantification is not possible. The heterogeneous behavior of different aquifers in each basin resulted in large uncertainty values compared to those from GRACE or precipitation. Groundwater level has been dropped in most main river basins of Iran, except for the basins near the Caspian Sea, namely Talesh (12), Haraz-Sefiidrood (14), Haraz (15), Gharesoo (16), and South Baluchestan (29) (see Fig. 10 (b)). The maximum loss has occurred in the Mehran-Kal (27) at the rate of ??47.7?±?6?cm/yr, followed by Saghand (49), Abarghoo-Sirjan (44), Ghareghoom (60), and Namak Lake (41). Based on the piezometric well observations, more than 90% of the aquifers show negative trends within the study period while in 35% of them, the groundwater level has dropped more than 40?cm/yr. Fig. 10 (a) depict the TWS loss rate using the GRACE observation within 2003–2016 which is the same period of GWLA data (Fig. 10 (b)). The annual rate of the mean groundwater level drop in this study is consistent with a recent estimation by Noori et al. (2021).
Fig. 11 (a) represents the groundwater level anomaly (GWLA) time series for entire Iran, together with the TWSA from GRACE, over the period from 2003 to the end of 2016. We observe that the GWLA is highly correlated with TWSA (Corr.?=?0.97). The mean GWLA in Iran has dropped dramatically during the last two decades, triggered by the drought in 2007. Considering the period from 2003 to 2016, the mean groundwater shows a significant negative trend of about ??28?±?1.4?cm/yr while this rate was about ??8.1?±?3.3?cm/yr and ??25.3?±?1.9?cm/yr before and after 2008, respectively. The high correlation and the same trend behavior between TWSA and GWLA highlight the notable contribution of groundwater depletion in Iran’s TWSL observed by GRACE.
The green and red background in Fig. 11 (a) refer to the two distinct patterns observed in the scatter plot of the TWSA versus groundwater level Fig. 11 (b). Except for the humid regions (about 15% of the country) with considerable contribution from soil moisture anomaly (Rahmani et al., 2016 and the variation in Lake Urmia in the northwest (Tourian et al., 2015, Ashraf et al., 2019), the GWSA is the dominant compartment of the TWSA in most of Iran. Therefore, the scatter points’ slope implicitly reveals the storativity or the storage coefficient since it maps the water table to the volume quantity. For an unconfined aquifer, which most aquifers in Iran are, the storage coefficient is approximately equal to the specific yield. Two distinct slopes, the green line from 2003 to 2007 about 0.072 and the red one from 2008 to 2016, 0.04, implicitly indicates that the acceleration in groundwater loss in last years brought the groundwater to a deeper level with a different soil structure (Fig. 11 (b)). Another likely reason can be that groundwater extraction in many regions of Iran has become more challenging and expensive as the groundwater drops. Also, below a certain level, there may not be even much water left for extraction (at least for a period of time in each year).
6. Discussion
This study quantifies the TWSL in Iran’s 30 major river basins over the last 17 years (2003–2019). The findings based on GRACE observations show a significant water loss in all basins of Iran, leading to a TWSL of 211?±?34?km3 (Fig. 4) at a rate of ??12?±?2?km3/yr. Our findings are consistent with those reported by previous studies focusing on different time periods (e.g., Voss et al., 2013, Forootan et al., 2014, Joodaki et al., 2014, Ashraf et al., 2021, Panahi et al., 2020). The total water consumption in Iran is estimated at about 96?km3 (Khoosefi, 2018). Hence, our analysis shows that Iran has lost more than twice of its annual water consumption over the last two decades. Most of the water has been lost during 2008–2016, triggered by one of the two most severe droughts of the last 50 years in the Middle East. Due to the coarse spatial resolution of GRACE, the results over smaller basins come with inherent uncertainty. Moreover, the results in the Caspian Sea coastal region are prone to leakage error due to the strong negative trend in the signal of the Caspian Sea. Using the piezometric wells observations, two recent studies, namely Ashraf et al. (2021) and Noori et al. (2021), estimated Iran’s groundwater storage depletion within 2002–2015 to be around 75?km3. Based on our analysis, Iran has lost about 241?km3 of its TWS within 2003–2015. Considering TWS as the sum of groundwater, surface water, soil moisture, and snow water, we can derive an estimate of about 166?km3 for the water loss from the surface, soil, and snow in Iran within 2003–2015. The shrinkage of the Lake Urmia (about 11?km3) and the reported d(r)ying up lakes like Lake Hamun and Lake Bakhtegan, narrowing of permanent rivers width, and the disappearance of seasonal rivers are only a few shreds of evidence in agreement with this estimate.
In 17 basins, despite a water gain from precipitation within the study period, the TWS has dropped. These basins, covering about 55% of the whole country, are mostly located along with the mountainous areas. Excluding the heavy rainfall of early 2019, still 15 basins (out of 17) show gain in precipitation. The coastal basins Talesh (12), Haraz-Sefiidrood (14), Haraz (15), Gharesoo (16), and South Baluchestan (29), show a positive overall rate in the time series of their groundwater level. This observation suggests that a considerable amount of water from precipitation in these basins has infiltrated into deeper soil layers and has recharged aquifers. The water loss seen by GRACE in these five basins can be explained by a possible, significant amount of runoff into the Caspian Sea (basins 12, 14,15, 16) or into the Sea of Oman (basin 29) and evapotranspiration from vast agricultural fields.
On the other hand, in 60% of the basins mentioned above, the discrepancies between the water storage loss seen by GRACE and the gain from precipitation can be explained with the considerable negative rate of groundwater loss (see Fig. 10). These basins were among the top 15 in groundwater loss, indicating a remarkable contribution of anthropogenic effects mainly via expanding agricultural activities. Groundwater storage loss can be investigated via data assimilation techniques to some extent (e.g., Li et al., 2019). Moreover, groundwater storage can be estimated from the mean groundwater level using the storage coefficients. Nevertheless, due to the lack of accurate storage coefficients, it is impossible to quantify the contribution of the groundwater to the TWSL for each basin. However, the high correlation (0.97) between groundwater drop and TWSA (Fig. 11) indicates a substantial contribution of water withdrawal from agricultural wells in the observed negative trend. Tourian et al. (2015) reached the same conclusion over the Lake Urmia basin using the correlation between GWLA and TWSA. It should be noted that, however, for more convincing conclusion, one would need to estimate GWSA and conduct a causality analysis.
We highlight that the piezometric wells’ observations are limited mainly to the groundwater level in aquifers. These aquifers are located in the plains, excluding groundwater flow in mountainous terrains. In case the measurements in mountainous regions were available, we would expect a higher rate of groundwater withdrawal due to the bedrocks’ steeper slope. However, since the main groundwater level fluctuations occur in irrigated plains, the contribution of groundwater depletion in the mountainous regions in the estimation of total groundwater decline should be negligible. Considering the potential role of the surface-groundwater interaction, it should be noted that, the accelerated increase in the water withdrawals over the recent years would result in the decrease of the groundwater contribution to the baseflow. This decline has already been observed in the Lake Urmia basin by Vaheddoost and Aksoy (2018) and needs to be further investigated in other basins, especially in mountainous regions.
In an arid to a semi-arid region like Iran, groundwater is a precious resource functioning as the backbone of irrigated farming. The alarming accelerated rate of groundwater withdrawal after the 2007 drought continued till the end of 2016. Maghrebi et al. (2020) assessed Iran’s agricultural activities within 1981–2013 using agricultural area/production data from Iran’s Ministry of Agriculture Jihad, Ministry of Energy, and Ministry of Roads and Urban Development. Our results from piezometric wells confirm the finding from Maghrebi et al. (2020) that the groundwater over-exploitation for agriculture and consequently irrigated agricultural production increased despite declining water availability during 2003–2016. Since the rate of recharge is slower than the pumping, many aquifers would be in danger of being depleted, and their water content never be recovered like aquifers in the agriculturally active regions of the world such as High Plain Scanlon et al. (2012) and Central Valley aquifers (Famiglietti et al., 2011) in the United States or the North China Plain (Feng et al., 2013). The observed decrease of groundwater extraction in many parts of Iran (Fig. S5) is attributable to the physical constraints and the inefficiency of pumping (due to high groundwater depth or low water quality) and not necessarily to groundwater conservation and monitoring efforts across the country (Madani, 2014, Tourian et al., 2015, Ashraf et al., 2017, Ashraf et al., 2021, Noori et al., 2021).
Lake Urmia in northwestern Iran is one of the largest lakes in the Middle East. This hypersaline lake has shrunk drastically over the last two decades to less than 30% of its original surface area and it lost more than 30% of its water volume from 1995 to 2015. Based on the results presented in Fig. 8 and Fig. 9, the basin has lost water at a rate of ??0.7?±?0.05?km3/yr, one of the top 6 river basins in losing water storage in Iran over the study period (Fig. 5 (a)). Although the overall deficit from precipitation over the last two decades is mild, the basin has suffered from a long period of persistent water loss from 2007 onwards (Fig. 6). The expansion of agricultural land (Khazaei et al., 2019), together with water loss from precipitation, put pressure on this basin’s water resources and encouraged increased groundwater use.
This study has quantified the TWS loss within the last two decades over Iran and its 30 major river basins together with the analysis of the precipitation and the groundwater level. The alarming values reported in this study justify further investigations to be conducted to understand the underlying reasons. The country-wide analysis of the hydro-climatic variables like temperature, vegetation indices, and evapotranspiration must be conducted along with the assessment of the long-term impacts of water resources management strategies adopted by the decision makers such as dam construction and inter-basin water transfers. Further studies can also benefit from the focused investigation of the interactions of the water resources in the border basins.
7. Conclusions
This study quantified water loss in Iran and its 30 major river basins over the last two decades using observations from satellite gravimetry (GRACE and GRACE-FO), precipitation datasets (gauged and global gridded), and groundwater from piezometric wells. We used a Monte-Carlo simulation method to quantify the non-linear trend and stochasticity of the TWS data. To interpret the TWSL, we determined gain or loss in water status (from precipitation), taking precipitation as the primary input to the water system. We selected a set of precipitation datasets with the best performance for each basin using observations from a dense network of rain gauges. We also computed the groundwater level depletion from 13,879 piezometric wells over the last two decades. In summary, the study results suggest that:
Iran’s TWSL was about 211?±?34?km3 over the 2003–2019 period with an average rate of ??12?±?2?km3/yr, which is significant for a country with limited water resources availability. The water loss rate varied between ??0.07 to ??1.8?km3/yr in the 30 major basins with the highest depletion in the Central Desert basin (47) and the lowest in the Ghareghoom basin (60).
The variation of TWS was 7.4?cm occurring in three main phases, i.e. from 2003 to 2007 (8.5?cm), from 2008 to 2015 (7.4?cm), and finally from 2016 to 2019 (9?cm). A significant deficit in water input in 2008, 2010, 2013, and 2014 led to the smaller annual variation of water storage throughout 2008–2015. Given a normal situation without drought periods, the annual variation of TWS over entire Iran seemed to vary within 8.5–9?cm.
Overall, the whole country has gained water from precipitation at the rate of +?4.9?±?0.02?km3/yr with respect to a long-term (1983–2002) reference. About 46% of Iran showed precipitation deficit with the overall rate of ??5.4?±?0.03?km3/yr and 54% of the country gained water with the overall rate of +?10.3?±?0.03?km3/yr. The Karun bain (23) experienced the largest gain (+?1.9?±?0.25?km3/yr) while its neighboring Karkheh basin (22) had the largest deficit of (??1?±?0.11?km3/yr) among the major basins.
Our analysis highlights two significant extreme periods, namely the 2007 drought and early 2019 flood. The drought period changed the status of at least five basins from water gain to water loss. It aggravated the deficit in 9 basins, and resulted in a total deficit of 115?±?0.6?km3. On the other hand, Iran gained the same amount of water, 115?±?0.8?km3, from the floods in early 2019. However, these floods did not remedy water scarcity, since a large portion of flood water did not recharge groundwater. However, it positively contributed to water resources in all major basins, especially the Mehran-Kal (27), South Baluchestan (29), and Central Desert (47) basins (20% of the total area).
The mean groundwater level of Iran showed a significant negative trend of about ??28?±?1.4?cm/yr, highly correlated (Corr.?=?0.97) with the GRACE TWSA from 2003 to 2016. The high correlation and similar trend behavior between TWSA and GWL indicates a notable contribution of groundwater depletion in the GRACE water storage decline.
Groundwater level declined at a rate of ??8.1?±?3.3?cm/yr before 2007 and accelerated (??25.3?±?1.9?cm/yr) after the 2007 drought. The maximum water depletion occurred in the Mehran-Kal (27) at the rate of ??4.35?cm/yr, followed by the Saghand (49), Abarghoo-Sirjan (44), Ghareghoom (60), and Namak Lake (41) basins. About 35% of aquifers were mined at a rate of more than 40?cm/yr.
We derived an estimate of about 166?km3 for Iran’s water loss from surface, soil, and snow water during 2003–2015. This is obtained by subtracting the estimate of groundwater storage loss from recent studies of Ashraf et al. (2021) and Noori et al. (2021) 75?km3 from our estimate of water storage loss over the same period 241?km3.
We observed two distinct patterns in the relationship between the TWSA and groundwater level. One with a slope of 0.07 over 2003–2007 and the other with a slope of 0.04 during 2008–2016. This finding suggests that accelerated groundwater loss in recent years brought the groundwater level to a deeper level with a different soil structure.
This entry was posted on
Wednesday, May 4th, 2022 at
9:47 am and is filed under
Iran. You can follow any responses to this entry through the
RSS 2.0 feed.
Both comments and pings are currently closed.